
Saturday, May 28, 2011
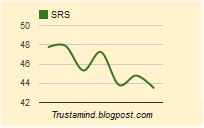
Sector Rank Spread Shrank and Down Trend Confirmed
The Sector Rank Spread shrank again last week. As it made a new low, technically a down trend is confirmed. This, together with the sharp drop of BMI, is alarming because smaller spread indicates less tendency of sector rotation and thus less fuel to the bull market.
Friday, May 27, 2011
ETF Ranking: Growth vs. Value
In an early post I showed that we can use ETF rankings to gain insight on where we are in a business cycle by mapping it to the Sector Rotation road map. I found another road map of Growth vs. Value on Interactive Investor's blog, of which I can make similar use.

The research was carried out by Morgan Stanley. It states that value stocks will outperform during early stage recovery and mid-stage bull market, growth stocks will outperform during mid-stage bull market to peak of bull market, then in bear market, balance sheet will outperform till the bottom. Although I'm not aware any ETFs representing balance sheet, there are value ETFs and growth ETFs. Because a highly ranked ETF will outperform the market, we can use this predictive power to learn where we are in the business cycle.
I select iShares growth and value ETFs: IWD, IWF, IWN, IWO. Their ranks are listed below:
- IWO, Russell 2000 Growth Index ETF: 63.19
- IWF, Russell 1000 Growth Index ETF: 58.54
- IWD, Russell 1000 Value Index ETF: 44.77
- IWN, Russell 2000 Value Index ETF: 42.21
Clearly growth is more fundamentally attractive than value at this moment. According to the chart, probably we are in the late stage of a bull market. This matches with the conclusion in our ETF ranking and sector rotation post.
To understand when we will be in a bear market, it would be handy to have an ETF represent balance sheet. If its rank is higher than growth ETFs, then highly likely we are at the beginning of a bear market. If you know a good balance sheet ETF, please let me know.
Thursday, May 26, 2011
My Comment to Interactive Investor's Latest Blog Post
Below is my comment to Interactive Investor's latest blog post: "Mines flood Nifty Thrifty screen". The author worries that "if next year is a bad year for resource companies, it will be a bad year for the Nifty Thrifty", though I think this is just the normal Sector Rotation phenomenon. I think my comments is informative so I just repost it here.
* * *
Thanks for the post. I have similar experiences.
I also have a ranking system similar to Magic Formula. Roughly speaking, Magic Formula has two components: valuation and return on capital. I added one more: financial condition. I tweaked a little bit the formulas within valuation and return on capital, though.
Although I traded my ranking system for only a couple of months, I see the same thing you discussed here. One month ago, all the top names are mining companies, including RIO. But not anymore. I think some bad fundamental numbers entered the earnings reports during this earnings season. As a result, the ranks of top ranked mining companies dropped abruptly.
Nonetheless, I believe it is normal that certain sectors / industries are favored at certain phases of a business cycle. This is actually the well studied Sector Rotation phenomenon. I don't have predictive power so I worry less what's going to happen one year down the road. But I believe I'm in good hands as long as my ranking system tracks the fundamentals closely. If commodity price crashed in the future, the fundamental numbers will crash, too. My ranking system will reflect the changes and I'll exit the positions. In fact this already happened with my ranking system. As mentioned before, now the mining companies are not top ranked anymore and I don't have any of them in my portfolio.
One key point I'd like to mention is: How often do you update the ranks. I insisted to update the ranks every week with my ranking system. Fundamental numbers change slowly, but the changes are usually abrupt. For example, the rank of RIO dropped about 20% one month ago. I think if I don't update the ranks frequently, I'll miss big profit or get caught by big loss.
Another thing is I'm not sure which EY are you using. Some value investor will use 10 year average. But I'll use ttm number. For one, ttm is more popular so it's going to have bigger impact on price, at least in short term. For two, ttm is more sensitive to changes. There will be fluctuations, but I think it pays to follow the fluctuations in the long run.
Wednesday, May 25, 2011
Big Money Index Drops Sharply
The Big Money Index drops sharply today. Usually this not a good sign as it indicates that money has flowed out of the market massively. Nonetheless the positive divergence is still valid. Cautions is highly recommended. Investors and traders want to monitor BMI closely in near future.


Sunday, May 22, 2011
First Editor's Pick from GuruFocus.com
My latest article "Wisdom of Warren Buffett: Avoid Dramatic Growth" wins "editor's pick" from GuruFocus.com.

As I just checked, it is now the front-page headline on GuruFocus.com.


As I just checked, it is now the front-page headline on GuruFocus.com.

Saturday, May 21, 2011
Sector Rank Spread Expanded But A Potential Down Trend
The Sector Rank Spread expanded last week but it may have formed a down trend. Diminishing SRS indicates less tendency of sector rotation and thus less fuel to the bull market. Cautions are recommended.


Wednesday, May 18, 2011
Sector ETF Rankings Match with S&P Upgrades and Downgrades
A recent Barron's blog said that S&P rated energy sector to overweight, downgraded materials to market weight and financials to underweight. I mention this because it matches with our Sector ETF Rankings for the week, which put XLE at top, followed by XLB, and XLF at bottom.
Tuesday, May 17, 2011
Gossip on Sector ETF Rankings - May 17, 2011
Although I have only a few data points, I think I have some proof to show that ETF ranking does drive short term return, barring any fundamental changes.
For the week starting on May 9th, my ETF ranking put XLB slightly above XLE. And for the first two day of that week, XLB rose 2.31%, slightly higher than the 2.23% rise of XLE. But then both reversed their courses in the rest of the week. By Friday, XLB was down 1.78% for the week, a bigger one than the 1.35% drop of XLE for the week. My guess is that fundamentals deteriorated in materials sector duing that three days so XLB was down more severely for the week. Actually, if you pay attention to this week's Sector ETF ranking article, you'll find that we did see fundamentals deterioration in materials sector in the week before.
The same happened for the first two days of this week. My ETF ranking put XLE slightly above XLB for this week. By today's close, XLE is down 0.76% for the week, relatively better than the 1.53% drop of XLB. As the earnings season is approaching to its end, hopefully we won't see any fundamental changes for the rest of the week. And hopefully XLE will continue to outperform XLB in near future.
Saturday, May 14, 2011
Sector Rank Spread Shrank Last Week
The Sector Rank Spread shrank last week, indicating less tendency for sector rotation and less fuel to the rally. Admittedly this conflicts with BMI's positive divergence. Because BMI has longer track record, I am still bullish right now. Nonetheless, a shrinking spread is a warning sign and suggests caution down the road.


Thursday, May 12, 2011
Positive Divergence of BMI
Today the Big Money Index forms a positive divergence with respect to the S & P 500 Index. If history is any guide, the market is expected to move to a new high soon.


Wednesday, May 11, 2011
My First Article On GuruFocus --- And "Wisdom of Warren Buffett" Will Be Exclusive to GuruFocus In Future
My article "Wisdom of Warren Buffett: The Willingness to Walk Away" is accepted by GuruFocus.com. Good news indeed. But I also have another piece of news to share. In future I'll make my "Wisdom of Warren Buffett" articles exclusive to GuruFocus.com. Readers can follow this link to view all my GuruFocus articles.
Tuesday, May 10, 2011
Wisdoms of Warren Buffett: The Willingness to Walk Away
In his 2010’s letter to shareholders, Warren Buffett discussed the four disciplines that make a sound insurance operation. Many insurers passed the first three. It is the last one that distinguished Buffett from others: the willingness to walk away.
Buffett said:
At bottom, a sound insurance operation requires four disciplines: (1) An understanding of all exposures that might cause a policy to incur losses; (2) A conservative evaluation of the likelihood of any exposure actually causing a loss and the probable cost if it does; (3) The setting of a premium that will deliver a profit, on average, after both prospective loss costs and operating expenses are covered; and (4) The willingness to walk away if the appropriate premium can’t be obtained.Many insurers pass the first three tests and flunk the fourth. The urgings of Wall Street, pressures from the agency force and brokers, or simply a refusal by a testosterone-driven CEO to accept shrinking volumes has led too many insurers to write business at inadequate prices. “The other guy is doing it so we must as well” spells trouble in any business, but none more so than insurance.
As simple as that.
What Buffett said applies not only to insurance. It applies to all businesses, to investment as well, because investment is a business. Like insurers, many investors cannot resist the urge to put money to work. It is always a sad thing when the market is in rally mode but an investor is not a part of the game. “The other guy is doing it” is an often cited excuse. And I’ve heard a better one.
When confronted, many investors would say that Buffett can walk away because he’s so wealthy. He can afford to miss a couple of opportunities. But I am not Buffett. I couldn’t afford to miss any. What if this is once-in-a-life-time and I missed?!
If we put their reasoning together with their often unpleasant returns --- if there is any --- the logic is funny because literally they are saying: I’m poor, so I can afford the risk to be poorer. Forgive me if this sounds harsh. But I know many people, such as gamblers, subscribe to this logic.
Back to their logic, I’d like to point out that it is actually the other way around: Buffett is wealthy because he is willing to walk away. It is not that he is willing to walk away because he is wealthy.
Look at Buffett’s spectacular investment returns (on page 2 of his 2010 letter) and ask, if he risked $1,000 in 1965, how much would that $1,000 worth today. The math is simple. Buffett’s compounded annual gain is 20.2% as listed on the same page. In 45 years, $1,000 will grow to about $4 million at that rate. If Buffett didn’t do a good job to walk away, he will not become the legend.
I would like to suggest everyone memorizing the number. Whenever you want to put $1,000 to work and think you can afford to risk that $1,000, ask yourself, could you really afford to risk $4 million in 45 years?
* * *
Finally I started reading Buffett’s letters. I would like to do it slowly so the content would have time to settle in my mind. I’ll share my progress here. Raise your voice if any of my comments is inappropriate.
Sunday, May 8, 2011
Value Is Less Risky Than Growth
I just came across another interesting article on the web: "Are Value Stocks Riskier than Growth Stocks?" The author presented data showing that value stocks not only produce better return, they also come with less relative risks.

The author presented interesting discussion I would like to borrow. The author started by saying that most value stocks are perceived to be risky because they are "distressed", then he made a distinction between "distressed" and "risky" by saying

The author presented interesting discussion I would like to borrow. The author started by saying that most value stocks are perceived to be risky because they are "distressed", then he made a distinction between "distressed" and "risky" by saying
[M]ost value companies, although distressed, are not bankruptcy risks, and most in fact have earnings.
Then the author pointed out that, people also worried that "distressed" companies may go bankrupt during business downturn, while they might do good during normal business conditions. However, if this is the case, then value stocks have to under-perform growth stocks during business contraction, which is not the case.
The author then said that in fact growth is more risky because they are commonly associated to bubbles. And the sad thing about bubbles is
Although the technologies prospered, investors lost their shirts by hideously overpaying for their growth.
Finally the author mentioned interesting market behaviors that favor value over growth, which makes a lot sense to me.
Finally, there are behavioral issues involved. Even efficient marketeers will admit that because of the lack of persistence of earnings growth, growth stocks are priced higher than the present value of their future earnings and dividends. Further, it is well established that negative earnings surprises hit growth stocks harder than value stocks and, in the same vein, positive surprises benefit value stocks more than growth stocks.
Value Consistently Outperforms Growth
Growth believers, don't argue with me cause I'm not the person who made such a big statement. I just came across an academic paper titled "Value Investing and the Business Cycle". It's about 10 pages long but mostly filled with easy-reading charts. I don't want to bore you with their data, I just jump directly to their conclusion.
- Although developed in the 1920s, value investing is still a major investment strategy. This research examines value investing in the context of the business cycle.
- The study compares a value-oriented portfolio with a growth-oriented portfolio in an expansion and a contraction period of the business cycle. The value portfolio includes stocks with a high book-to-market ratio (B/P), earnings-to-price ratio (E/P), cash flow-to-price ratio (C/P), and dividend yield (DY), while the growth portfolio contains stocks with low values of B/P, E/P, C/P, and DY.
- Three risk-adjusted performance measures—Sharpe (total risk-adjusted), Treynor (market risk-adjusted), and the information ratio (portfolio-specific risk-adjusted)-are used to compare the performance of the two portfolios.
- Evidence suggests that the value portfolio consistently outperforms the growth portfolio throughout the business cycle.
And in their concluding remarks, the authors again articulated that
This superior performance is robust for all economic conditions, meaning that investors will be better off investing in stocks with high valuation ratios versus stocks with low valuation ratios regardless of economic conditions. The benefits of value investing are even greater during periods of contraction than during periods of expansion.
So it appears, based on their research, growth stocks have chances only during expansion periods. But even during expansion periods, value stocks still outperform.
Don't ask my opinion on this. I'd say this research paper is interesting.
Saturday, May 7, 2011
Sector Rank Spread Expanded Last Week
Previously I talked about that Sector Rank Spread indicates the tendency of money rotating among sectors, which will add fuels to the bull market. SRS expanded a little bit last week. Together with the surprising resilient employment number it implies that this bull market may still have legs.


Friday, May 6, 2011
ETF Ranking: My First SeekingAlpha Article And Valuable Comments
My first SeekingAlpha article is titled: "ETF Ranking: A New Fundamental Approach That Drives Short-Term Return". I'm not allowed to publish the same content on my blog. Just copy the first paragraph over.People posted valuable comments following my article and I feel it would be good to copy some over. The discussion is mainly centered on growth vs. value. My take away is that
ETF Ranking Favors XLE and Dislikes XLF for the WeekThe ETF ranking is an extension of our newly designed stock ranking system that ranks every stock based on its valuation, financial condition, and return on capital. Although the ranking system is fundamental based, it actually drives short term return. We observed that stocks with higher ranks had a strong tendency to outperform those with lower ranks over a period of one week. The data show that moving up 10 rank points translates to an extra annualized return of 1.7% in the past 10 years, if ranks range from 0 to 100.
- Chasing trailing twelve months (ttm) growth number is too late to the game
- Projected growth number may be a better choice, but it's inherently difficult to evaluate the quality and credibility of the projected number
- Hence the best way to evaluate growth is to do it on a case-by-case basis. There may not be a good formula to represent growth, and hence it's difficult to integrate it into my fundamental ranking system.
It's just my take away and it's always debatable.
Below are the comments:
By the way, don't be so sure growth and value are antagonistic. Books, etc, make it seem that way and that's understandable; it's a lot easier to sell a book if it can be easily classified per a particular style so devotees of that style can recognize it as something that would be of interest to them. Actually, though, growth and value are much more aligned than many realize.
[Y]ou may want to work with PEG (the PE to growth ratio). For PE, I suggest using price divided by estimated EPS. For growth, use the consensus estimated long-term EPS growth rate. Many say a PEG should be equal to or less than 1.00. Actually, though, that's folklore. Realistically, PEGs below 2 tend to be reasonable. Now, here's the hard part. Critically evaluate the growth projection. That's important. Value errors usually come from latching onto a not-so-credible growth forecast.If you work that way, you'll develop a strong sense of stock market value (one that is not at all antagonistic to growth).
I'm not talking about quality of growth; I'm talking about the credibility -- believability -- of the projections. A P/E of 25 on shares of a company with a projected 30% growth rate sounds great . . . unless you look more closely and decide that the 30% expectation is nonsense. The hard part is that there is no easy way to assess this; if there were, then everybody would be spot on in terms of stock valuation and there would be no opportunity for a value investor!
Thursday, May 5, 2011

Wednesday, May 4, 2011
BMI: Potential Positive Divergence
The S & P 500 Index falls quickly lately. But my Big Money Index is still pointing up. There might be a positive divergence under development. If history is any guide, the market may repeat its mid-April course. We shall see.


Tuesday, May 3, 2011
AAPL vs. RIMM
A piece of news caught my eye saying that “Apple has overtaken Research in Motion as the third largest cellphone maker in the U.S.” It interested me because as I checked last weekend with my fundamental ranking system, RIMM was ranked 97.88, slightly higher than AAPL at 97.70. Although statistically there is strong tendency of higher ranked stocks to outperform lower ranked ones over a period of 1 week, a difference of 97.88 - 97.70 = 0.18 doesn’t really mean anything. Remember that my fundamental ranking system ranks stocks by valuation, financial condition, and return on capital. The virtually equal ranks mean that there is virtually little difference between AAPL and RIMM as far as valuation, financial condition, and return on capital are concerned. In fact, they are both exceptional.
However the news is alarming. RIMM is losing competitive edges to AAPL. If the “trend” (I put quotation marks to differentiate it from technical trend) continues, it’s a sure thing that RIMM will underperform AAPL in the future. In fact the market already voted against RIMM by its feet, RIMM is about 30% off its peak now.
The news basically says AAPL grows much faster than RIMM. This is not reflected in my fundamental ranking system because I deliberately removed growth from the system. My previous post showed that growth has negative impact on the over all performance. But that doesn’t equal to “growth is a bad thing”. The difference is subtle and let me spend some words to explain it. For a given stock, the ranking system will first give it a rank for valuation say 90, a rank for financial condition say 85, and a rank for return on capital say 95. Then it averages the three numbers to give a final rank which is (90 + 85 + 95) / 3 = 90. (Actually it’s a weighted average. But for the purpose of this post, it is OK we forget this inconvenient fact.) If we put growth into the mix, then the system will give the stock a rank on growth, and then average it with the other three ranks to produce the final one. It could happen that a stock that is less sound on valuation, financial condition, or return on capital will get a higher final rank because of its high growth rank. And this type of stocks will hurt the overall performance. So it really means that sacrificing valuation, financial condition, and return on capital for growth is the bad thing. Or, in plain English, growth is less important than valuation, financial condition, and return on capital.
Now let’s look back at RIMM and AAPL. They are almost equivalent on the other aspects. For this particular case, we should look at growth if we want to differentiate between them. There are other fundamental aspects we could look at. But because growth is so popular for these two stocks, as well as other hi-tech names, it pays to watch it closely.
When evaluating growth, value investors will not just look at the numbers. They look at stability and predictability of the growth numbers. There are math formulas devised for measuring stability and predictability. But let’s look at the charts first. Below are the charts of the earning growth for RIMM and AAPL, respectively.


Comparing the two charts, RIMM’s growth is volatile: it moves randomly and sees big ups and downs. It sees one negative growth number in the last 3 years. AAPL’s growth is more stable: it is closely clustered to a constant value, i.e., the straight line in the chart. All growth numbers are positive, and the minimum is 11.5, way above zero.
Value investors commonly use coefficient of variation (CV) to measure the stability of earning growth. CV is the standard deviation divided by the average. Large CV means that variation is relatively high, which implies bad stability and it would be hard to predict future values by historical data. Numbers and calculations are listed below.

Over the past 12 quarters, AAPL’s average earning growth is 63%, higher than that of RIMM at 55%. AAPL's CV is 0.55 while RIMM’s CV is 0.71. So AAPL’s growth number is better and furthermore its growth is more stable and predictable.
I’d like to point out one difference here that a fluent investor may have already noticed. Usually value investors look at CV on annual growth numbers for a long period of time, such as 10 years. What I have here is trailing twelve months growth number for each quarter and I only look at data in the past 3 years. I’m doing this because hi-tech is a fluid industry and under constant changes. 10 year is a very long period that’s going to average out a lot of changes. But some changes are game changers that are highly important. When did AAPL introduced iPad?
So if I have to pick one between AAPL and RIMM, I’ll pick AAPL. Some traders may view the 30% drop of RIMM a speculative trading opportunity because even a dead cat will bounce. That might be the case. But long AAPL is a better choice. AAPL’s fundamental quality is at the same level as RIMM, and AAPL’s growth is more stable and more predictable than RIMM. Go long AAPL may see better return than that of RIMM.
Does that mean a trader should chase the downward momentum to short RIMM? As discussed at the beginning of this post, RIMM’s fundamental quality is as exceptional as AAPL. Yes one can short, but fundamental is not on his side.
Because RIMM and AAPL are close competitors in the same industry, and RIMM and AAPL have almost the same fundamental quality, and AAPL’s growth potential is much better than RIMM, a trader may consider a pair trade strategy: go long AAPL and short RIMM in the same dollar amount. Personally I wouldn’t do this. Yes it is very likely that RIMM keeps losing market share to AAPL. But RIMM already fell 30%. At this price level, the risk of going short is way too high if anything unexpected happens.
Disclosure: I don’t have any position of AAPL or RIMM but is likely to establish a position of AAPL in the next 72 hours.
Sunday, May 1, 2011
In Between Entrepreneurs and Investors
The difference is really between an investor and an entrepreneur. Entrepreneurs want to be the best in their industry. For that purpose, the industry has to have room for them to grow. Chasing better quality, more capital expenditure, and the next generation products are the "rooms" that fit well entrepreneur's ego. Individually this is good for the entrepreneur, but collectively it is silly for the industry. The industry is just chasing its own tail. All the profit they earned from the growth they have to spend to protect them from fierce competition because growth invites competition. Investors know about this and avoid such type of industry at the first place. Buffett likes mature industry, where the battles have already been fought and blood has already been shed many years ago. Ancient survivors accumulated rich intangible asset --- reputation --- over time. That's the most valuable economic moat an investor likes to bank on.
Read Gannon's article on this for more details.
Subscribe to:
Posts (Atom)