- Why It's Time To Buy Energy: Our latest check shows that it’s time to buy the energy sector (XLE). We also suggest selling short the utilities sector (XLU) for investors who can hold short positions. (a) XLE is the top ranked sector ETF by our fundamental ranking system. And XLU is ranked at the bottom. (b) Our sector rotation road map shows that we are in early expansion, which favors strategies of buying offensive sectors – XLE in our case. (c) As the volatility is edging lower, we prefer to sell short defensive sectors to fund a long position, rather than sell short offensive sectors to reduce volatility. (d) Energy price is trending up. This will benefit the energy sectors and punish utilities.
Tuesday, November 22, 2011
External Publications - 11/22/2011
One article is published on SeekingAlpha.com today:
Tuesday, November 8, 2011
External Publications - 11/8/2011
One article is published on SeekingAlpha.com today:
- Thompson Creek: The Best Company in the Most Undervalued Industry: Thompson Creek Metals Company Inc. (TC) stands out in our search for the best investment opportunity: (a) Metal mining is one of the most undervalued industries by our calculation; (b) Thompson Creek has outstanding financial strength in the metal mining industry; and (c) Thompson Creek has a diversified portfolio, including safe haven bets such as gold and silver, and growth bets such as copper, plus strategic metal molybdenum, which saw stable demand even during the 2008-09 crisis.
Sunday, October 30, 2011
External Publications - 10/30/2011
One article is published on GuruFocus.com today.
- The Right Way To Estimate Industry Ratios: Industry ratios are more important than those of an individual company. A low PE ratio of a company could be distorted by various one-time items thus may not reflect the real earnings power of the company. But a low PE of an industry is often a sure bet for a structural opportunity. One-time items will positively impact some companies in the industry while negatively impact others. Those will cancel out one another. Likewise, some companies will adopt aggressive accounting schemes and others with conservative ones. Probability theory dictates that the "average" of a group of numbers resists the errors that may severely impact individual ones. With less error, industry ratios are more likely to reflect the industry's financial strength...
Thursday, October 27, 2011
New High Before January - Possible
Bulls are celebrating today and there might be more coming for them! The earnings season is approaching to its end and it is way better than investors had feared. The Q3 GDP number is released today, again it is way better than investors had feared. Besides, what happened in Europe and China is also encouraging. European leaders finally become serious about their problem, and Chinese leaders become more growth-friendly. Before January, that is before the next earnings season and GDP number, what will a sensible investor do if a big chunk of his money is still sidelined? Surely there the market will zigzag in the next three months. But when the trend is clear and strong, miss a day will miss a lot.
Tuesday, October 11, 2011
Up Till November
We see the market will move up till November.
Germany and France vowed to save their banks, and the market is rallying on that news, even if some European countries are still doomed to fail. The catch is that they didn't have a package yet. They promised to have it ready by early November. Coincidentally it's earnings season between now and November. Investors will pay more attention to earnings while waiting for the Merkel-Sarkozy package. Recent fall of the market already priced in a new recession. The market doesn't need to have super rosy earnings to rally. Technically the market already broke 50MA, a major technical resistance. The next stop will be 200MA. We see by early November the market will move up to 200MA where it will face a major challenge. Plus by that time the earnings season is about to end and investor will switch back to the endless European problem. The Merkel-Sarkozy package will make it or break it.
Cheers! Until November.
Tuesday, October 4, 2011
Closer to Bottom
It's hard to guess the exact bottom when markets around the world are all sliding down. But it should be close to the bottom. For two consecutive days, XLK is stronger than the S&P 500, and XLU led the market down. XLU was the star in the August, September crash. It climbed to a 52-week high recently while every other sectors suffered. Clearly money was hiding in the traditional defensive sector during the market meltdown. Now with XLU being weak and XLK being strong, those money is flowing out the pit where they were hibernating for the harsh winter to embrace a warm spring. I sense the spring is coming.
Tuesday, September 27, 2011
XLE:XLF Broke Long Term Trend Line After I Ditched the Pair
I've ditched the long XLE / short XLF strategy one week ago and then XLE:XLF pair broke long term up trend line. It appears that my ETF ranking is also good at timing the market.


Monday, September 26, 2011
Friday, September 23, 2011
Fundamentally Bullish, Sentimentally Bearish
Fundamentally now it is much better than 2008: there is enough liquidity in the financial system, and GDP is still growing. Even economists keep lowering their estimates on GDP, they still project growth. The problem is, the market is dominated by bearish sentiment. Many investors simply leave the market and stay on the sidelines. The only players in the market now are computer-driven momentum-chasing hedge funds. In the past two months, quant funds are the best performers in the hedge fund industry. If investors are indifferent and stay on the sidelines, nobody will stop the bearish momentum and we'll see new lows. Thus fundamentally I'm bullish, but sentimentally I'm bearish. I'll just stay with my strategy and enjoy the roller coaster.
Tuesday, September 20, 2011
External Publications - 9/20/2011
An article is published on SeekingAlpha.com today:
- New Solid State Drive ETNs Are Good Buy: Best investments are often found with solid fundamentals and creditable growth prospects. The newly incepted Solid State Drive ETNs are promising candidates.
Monday, September 19, 2011
External Publications - 9/19/2011
One article is published on SeekingAlphs.com today:
- Why The Technology Sector ETF XLK Is Riding High: The Technology SPDR ETF (XLK) is ranked at the top among sector ETFs and that indicates the economy is likely to expand on its own.
Saturday, September 17, 2011
Sector Rank Spread Leaps Ahead, A New Economic Expansion At Gate
The Sector Rank Spread leaped ahead. Beside that, I see other evidences that a new economic expansion is emerging. I'm composing an article for that. Will publish on SeekingAlpha.com once done. Stay tuned.


Saturday, September 10, 2011
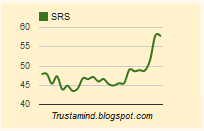
Sector Rank Spread Sees Big Jump Again
The Sector Rank Spread sees a big jump again. The key driver for this change is a sudden 5-point drop of XLF's rank. I expect to see the expansion of SRS leads the market up from here.


Top 3 on SeekingAlpha
Now I'm ranked as the top 3 "Opinion Leader" for "ETF Long & Short Ideas" on SeekingAlpha.com. Just dumped screenshots as a reward to myself. My pen-name on SeekingAlpha.com is Diffusion.


Thursday, September 8, 2011
External Publications - 9/8/2011
One article is published in SeekingAlpha.com today:
- Bet Against Unfounded Enthusiasm For Dividends - Pay More Attention To Quality: A company issuing dividends alone does not necessarily mean you should invest. The latest enthusiasm for dividends drove the iShares Dow Jones Select Dividend ETF (DVY) to an overvalued state.
Saturday, September 3, 2011

Thursday, September 1, 2011
External Publications - 9/1/2011
One article published today on SeekingAlpha.com
- Why MOO Will Stage A Swift Rally: We see four reasons that the Market Vectors Agribusiness ETF (MOO) will stage a swift rally.
Tuesday, August 30, 2011

External Publications - 8/30/2011
One article is published on SeekingAlpha.com today:
- 5 Reasons Emerging Markets May Not Live Up To Expectations: The widely expected growth of emerging markets could be already baked into the price, and investors will suffer if these markets fail to deliver.
Saturday, August 27, 2011

Wednesday, August 24, 2011

Monday, August 22, 2011
External Publications - 8/22/2011
One article is published on SeekingAlpha.com today:
- One More Thing Investors Need To Know About REITs: Low interest rates are not the only thing that determines the fate of REITs. They depend on functioning capital markets to stay afloat.
Saturday, August 20, 2011

Friday, August 19, 2011
RIMM Up 20% from Bottom, Garbage Effect in Play
RIMM, the most desperate hi-tech company, the loser in the the smart phone war, the orphan of the patent enclosure, rallied 20% from its bottom and stayed there when S&P 500 dropped another 5% this week. Considering it is still 65% off its May top, its latest strength is deafening. This is the so called "Garbage Effect" I wrote before. I've also predicted this to happen months ago in a tweet.


In short, the "Garbage Effect" is that a rising tide lift all boats. But garbage is lifted first than any boats, because garbage is the lightest stuff. If RIMM is rising, it means the tide is about to turn. Buy garbage to profit from the tide's reversal. Big caps and quality names will move much slower and will be lagging far behind.
Thursday, August 18, 2011
More Evidence on the Flagging Demand for Gold
While all the comments are negative to my latest SeekingAlpha article "Why Market Peak May Have Passed for Gold and Its Miners", Barron's posted a blog that provided another piece of evidence on the flagging demand for gold "Global Gold Demand Drops In Q2 As ETF Investments Fall". This is really an interesting experience.
External Publications - 8/18/2011
One article is published on SeekingAlpha today:
- Why Market Peak May Have Passed for Gold and Its Miners: Gold miners’ diminishing return on asset (ROA) could indicate flagging demand for the precious metal.
Saturday, August 13, 2011
Sector Rank Spread All Time High
The Sector Rank Spread made an all time high this week, though we only have less than four month history. It is an encouraging sign that the tendency of sector rotation edged up which signified that the bull market may still have legs.


Friday, August 12, 2011
External Publications - 8/12/2011
One article published on SeekingAlpha.com today:
- Hide in the Semiconductor Industry's Thick Pile of Cash With This ETF: By our calculation, semiconductor companies are hoarding a thick pile of cash that is equal to 21% of their stock prices. That’s where investors want to hide when future is uncertain.
Thursday, August 11, 2011
Negative Divergence on Big Money Index Keeps Going
The S&P 500 recovered all its yesterday's loss, while the Big Money Index only recovered a fraction of that. As a result, the negative divergence between S&P 500 and BMI keeps going. This is a more encouraging sign that the market may have bottomed.

Wednesday, August 10, 2011
Potential Negative Divergence of Big Money Index - Market May Turn Up
As mentioned before, the Big Money Index is now a lagging indicator, meaning if there is any negative divergence between BMI and S&P 500, the market may follow S&P 500 and it usually marks important turning point of the market. As of today, there is a tiny negative divergence: BMI made a lower low but S&P still held above its most recent lows. If it prevails, S&P 500 will turn here and move up. Anyway, it is still developing. Investors want to pay close attention to it down the road.


Good Time to Load Up the XLE/XLF Long Short Pair
Readers of my SeekingAlpha articles may be familiar with the simple long XLE / short XLF strategy I've been advocated for months. As the pair XLE:XLF is now on the long term up trend line, forming a double bottom and bouncing up, it may be a good time to load up the pair. Nonetheless this is a pure technical call trying to time the market.


Monday, August 8, 2011
Stabilizing Signs
OIS-Libor spread, TED spread, and China's A share are stabilizing. The real fear is contained. The sell off is exaggerated. Once the bottom is in, the rally will be equally violent.
Another Piece of the Puzzle: Double Dip Mortgage Crisis
Barron's reported that "AIG is planning to sue Bank of America to recover more than $10 billion in losses that the insurer incurred over mortgage-backed securities". Pieces of proof are just piling up for a double dip mortgage crisis.
Saturday, August 6, 2011

Friday, August 5, 2011
Double Dip Mortgage Crisis
As a nice follow-up of yesterday's post where I mentioned the widening OIS-Libor spread, this morning Bank of American reported that its Fannie, Freddie exposure may be worse than anticipated. This sounds a lot like a double dip mortgage crisis. I believe it is the unknown unknown that alarmingly but quietly drove up the OIS-Libor spread and is not covered in the media and embedded into investors' mentality, necessary conditions for a perfect storm.
Thursday, August 4, 2011
Wait for QE3 or a Exhaustion Round Bottom
The stock market is like a rubber band. When stretched, it either snap back or is broken. I think it's broken today though many think today is capitulation. Hopefully I'm wrong.
One piece of news concerned me is European banks collapsed today and European Central Bank restarted its bound buying program. I noticed that the TED spread and the OIS-Libor spread both widened significantly lately, which usually means there is a major credit risk down the road. European banks could be it and as far as I know it isn't covered in the media and is beyond imagination of most investors --- necessary conditions for a perfect storm.
Many investors are still hoping for QE3 that, they think, will save the world. But if there is a major risk down the road, the Fed will be careful to save its few bullets, if not the last one. It may take a couple more crashes like today before the Fed jump in. Investors want to act after, not before, the Fed, because the market drops fast, very fast.
Barring QE3, there isn't anything I can imagine that will turn over the economy. Then investors have to be patient to wait for an organic recovery which will be signaled by an exhaustion round bottom. Count years, not days, for this.
Saturday, July 30, 2011

Monday, July 25, 2011
External Publications - 7/25/2011
One article is published on SeekingAlpha today.
- Long Energy, Short Financial ETFs Play: Readers of my ETF ranking articles should know that I’ve been advocating a simple long energy (XLE)/short financials (XLF) strategy since May. The strategy returned a combined 5% since inception while the market, represented by S&P 500 (SPY), registered a -1% return...
Saturday, July 23, 2011

Friday, July 22, 2011
Institutions, Dumb Money, and Day Traders
Bespoke opined that the recent rally was driven by dumb money because the market moved higher in the first hour but lost steam in the last hour. I think Bespoke's reasoning is flawed. It forgot to account for the day traders, who trade for very short term and drive the market up and down by enormous amount of liquidity. Dumb money, or individual investors, is the most vulnerable under day traders' attack. I'd imagine that day traders will take the other side of dumb money and because day traders are more sophisticated and powerful, market will move against dumb money's intention. So if we see the market surges in morning, probably it is day traders that move the market up, trying to squeeze dumb money who's selling.
And it is normal that in the last hour the market moves in the opposite direction from that of the first hour, simply because day traders always close all positions - which they opened in the morning - before the market closes.
All in all, dumb money is not supposed to move the market, they are supposed to hold the bags after the market is moved.
Monday, July 18, 2011
External Publications - 7/18/2011
One article is published on SeekingAlpha today.
- Economy Is Better, but Banks Will Remain Under Pressure: Although last week there was good news from banks’ earnings reports, their stock price will be under pressure in near future...
Impression, Earnings Reports
It is one weeks into the earnings season and we have developed an impression that the economy is growing. But there is another crucial factor that will negatively impact the trajectory of the market, the Europe debt issue.
We focus our discussion on financials sector and energy sector, as we are long XLE and short XLF based on our ETF ranking system. There are a couple of high profile earnings reports from these two sectors, JPMorgan Chase last Thursday, Citigroup last Friday, and Halliburton today. The numbers are rosy: all of them beat EPS and revenue expectations. Moreover, both JPMorgan Chase and Citigroup’s business loans grew in the past three months ended in June. And Halliburton eyed surging demand and growing margins. All the facts point to a more active economy and GDP growth, and a higher price level of the stock market.
Nonetheless, banks are still under pressure in an unfriendly macro economic environment. Their stock prices moved lower in face of new unfavorable regulation policies, litigation costs, and low interest rates.
The most critical issue is the Europe debt issue. It is reported this morning that “Debt Anxiety Pushes Financials Down as Bank of America, Goldman Hit Lows”. Although the Europe debt issue is already aged in years, it appeared that there is still no convincing solution. The direction of the stock market will be determined by the outcome of the duel between a growth U.S. economy and a deteriorating Europe debt issue.
Saturday, July 16, 2011
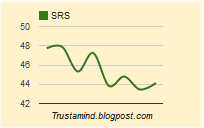
Sector Rank Spread Potential Downtrend
The Sector Rank Spread moved lower last week and now it's in a potential downtrend. It appears that last week's price action consumed some tendency of sector rotation. Nonetheless, fluctuations are normal in an earnings season, and I wouldn't read too much into it as for now.


Friday, July 15, 2011
Gossip on Sector ETF Rankings - July 15, 2011
It appeared that our long XLE / short XLF strategy successfully hedged a volatile first week into the earnings seasons. For the week, S&P 500 (SPY) fell 2%, XLE was flat, and XLF fell 4%. Investors who would end up with a 4% gain even when the market was falling. Our prediction was based on the predictive power of our ETF ranking system, which is a novel fundamental approach that drives short term return.
Thursday, July 14, 2011
Big Money Index Will Be Manually Updated Everyday After Market Close
The Google spreadsheet is not working well recently and dynamic data couldn't be updated for the Big Money Index. I have to change it back to manual mode. Data will be updated everyday after market close. Sorry for the inconvenience.
Tuesday, July 12, 2011
Valuable Analyses from a Reader and a Fundamental-Weight Cloud Computing Portfolio
Poppedcollar, one of my readers on SeekingAlpha posted excellent comments to my latest article: "The Growth Perspective of the First Trust ISE Cloud Computing Index Fund, SKYY". He gave insightful analyses on the prospect of cloud computing and a couple of selected companies. I'd like to copy them over.
Personally, I think MSFT, GOOG, INTC, WDC and STX all provide very safe exposure to a bullish cloud computing environment. WDC and STX may seem like a bit of a stretch but I seriously doubt any company would run a cloud with SSD. It's too expensive and too unstable. Regardless, I see WDC and STX being undervalued in any environment that will arise. Desktop PC's are far from dead and will remain a staple of personal and business computing. Tablets and smartphones are just an addon.MSFT is another company I see being profitable from any angle. Software is always useful and Microsoft dominants from this angle. Windows sales may drop (though this is due to PCs being upgraded less frequently, not that PCs are being less frequently used) but I think Microsoft will easily cover this in other areas including cloud computing.Google also follows the same reasoning as Microsoft with some added speculative hope for social networking. Honestly, I've been tinkering in the Google+ beta and its fairly lackluster right now but a few easy fixes and it could be significantly better than Facebook. Google (unlike Facebook) might also have some opportunity to monetize social networking by being able to draw for information about consumers. Facebook has...well a profile. Google has gmail and Youtube accounts. Youtube finds recommended videos that fit things you watch. This produces good demographics for someone posting an ad and as such, ads on Google+ will have much better targetting ability and generate a justifiably higher price tag.Intel simply dominates the processor market and I foresee it also doing well in other forms of computing (particularly clouds). They are the best of the best in servers and any gaming oriented machine.I'd play the software/supply angle which also captures other markets. I think it also captures the market better than a business that offers a service that may or may not be related to cloud computing (IE If it can be run off a normal network, it really isn't cloud computing).
And below is my reply:
I've checked my ranking system for the ranks of those companies. The ranks are listed below. It appeared that MSFT, INTC, and WDC are good value pick as for now.
- MSFT - 81.95
- GOOG - 57.05
- INTC - 86.70
- WDC - 79.11
- STX - 73.65
Actually another idea popped up while I'm writing this. We can create a fundamental-weight portfolio. The idea is buy low sell high. A company with higher rank is supposed to be "cheaper" than that with lower rank. So we want to load up more. The average rank of the market is 50. So the weight should be proportional to a company's rank minus 50. If its rank is less than 50, then it is expected to underperform the market and there is no reason to hold it.Thus the weight of each company should be
- MSFT - 24.87%
- GOOG - 5.49%
- INTC - 28.57%
- WDC - 22.66%
- STX - 18.41%
The rank is updated each week (because price change will affect valuation and thus the ranks). So it's better we rebalance this portfolio each week. The concern is trading cost, which can be reduced by a longer rebalance period.
Monday, July 11, 2011
Gossip on Sector ETF Rankings - July 11, 2011
S&P 500 (SPY) fell 1.8% today in face of ugly news erupted this weekend. XLF fell 2.7% and XLE fell 2.4%. Thus our long XLE / short XLF strategy still returned a combined positive 0.3% when the market collapsed. It appears to be an effective strategy to protect from downside risks.
External Publications - 7/11/2011
Two articles are published on SeekingAlpha today:
- Moving Into Earnings Season: Staying Long Energy, Short Financials: Alcoa (AA) will report earnings this Monday and unofficially kick off the earnings season. New earnings numbers will prove or disprove investment theses, and the market will see more fluctuations as investors punish losers and applaud winners. Sometimes the market moves drastically in face of any “surprises”, and it is highly recommended that investors have their portfolio protected from downside risks...
- The Growth Perspective of the First Trust ISE Cloud Computing Index Fund, SKYY: Last week the debut of the First Trust ISE Cloud Computing Index Fund (SKYY) – the first of its kind – attracted a lot of buzz in the media. It also received many critiques from analysts and investors...
There were interesting discussions for the first one and I'd like to recapture some key points I've made:
Personally I think copper is a better macro indicator than crude oil. It is said that copper has a Ph.D. in economy. Recently copper was very strong on the chart, much stronger than crude oil. That should say something about macro economic trend, at least investors' / traders' collective expectations about it.Secondly, in my opinion China is the engine of global economic growth, not U.S. I think copper and energy are hot because China is one of the biggest consumers of these two vital resources.Thirdly, the recommendation was not based only on macro views. Otherwise I'd recommend XLB instead of XLE. A hot product does not automatically make its producers rich, let alone its investors. An important part of the story is how effectively the industry translate products into cash flow. According to our ETF ranking system, energy sector is the best among its peers as for now.[T]his article was composed 36 hours ago. At that time the debt ceiling talk didn't fall apart and there wasn't yet another earth quake in Japan, as least I wasn't aware of. That's one sad thing about financial markets - nobody can foresee the future. What investors can do is to come up with good strategies to profit from the upside and, at the same time, to protect against the downside.One thing I've learnt from my experiences is to underweight news and overweight numbers. Debt ceiling talk fell apart but they will resume the talk sometime later. Japan earth quake will have negative impact but investors will, quite legitimately, start to think about the "pent up" demand for reconstruction. That's the nature of human beings, and that's the driver of zigzags of the market. Actually there was an article about this: "Why I Don't Watch CNBC".China's growth is driven by the demand from U.S., at least it was true in the past. China is the producer and U.S. is the consumer.But there are subtle changes already.U.S. is not the largest trading partner of China. Europe is the largest trading partner of China as for now.China has a large population, it would be a much bigger consumer if their demand is unleashed. As an early sign, China's trading with other Asian countries, most of them are poorer south east Asian countries, is constantly increasing in past years, and in those trades, China is playing as the consumer and the other countries are playing as the producers.Nonetheless the China - U.S. grand cycle is still working. But I think it's not to the benefit of either country to stick on to it.
Sunday, July 10, 2011
Companies Are Optimistic About Their Earnings
In this week's issue of Barron's, Shirley A. Lazo contributed a piece on the sunny outlook of dividends growth. The article reported that, according to S&P's senior index analyst Howard Silverblatt, dividend investors would see dividends rising 11.1% in the first half of 2011. More importantly,
He noted, too, that enrichments are commitments not just to current payments but to coming obligations. So it looks as if companies are optimistic about their earnings and cash flow down the road.
This is encouraging as we are about to enter the earnings season. We will see rosy numbers if the rising dividends correctly reflected companies' confidence towards the economy.
Saturday, July 9, 2011
Sector Rank Spread Fluctuates Ahead of Earnings Season
The Sector Rank Spread edged up slightly ahead of the earnings season, which will be unofficially kicked off by Alcoa's earnings report (AA) the coming Monday. Fluctuation is normal during an earnings season as new fundamental data enter the ranking system. In the past four weeks, the SRS was contained in a narrow band. We think that this week's slight change is not significant. We'll have a stable outlook after the earnings season.


Friday, July 8, 2011
Gossip on Sector ETF Rankings - July 8, 2011
If the market close here, the S&P 500 would be flat compared to last weeks close. But our long XLE / short XLF strategy would return a combined more than 2% in one week. Just want to reiterate the following key points
- It is necessary to have a protection when economic outlook is not clear
- Although XLF led the snap back, it would underperform because financials' dire financial strength
- Despite a falling oil price, XLE will rise if economy recovers.
Employment Is a Lagging Indicator
The ugly employment number is out and the market collapses. A good story for financial media but not necessarily a logical reaction for investors. That is because employment is a lagging indicator. A lagging indicator can confirm an economic trend, but cannot signal the beginning of a new one. Indeed, while employment is still struggling, retailers started to see growth already. The ugly employment number simply says that we are still around an inflection point of the macro trend. I'd overweight retail numbers, for now.
Thursday, July 7, 2011
SKYY Will Be a Market Performer
The new cloud computing ETF SKYY is hot in media these days. Still its viability is questioned by some prestige investors. Indeed, according to our ETF ranking system, it will be a market performer despite all the buzz surrounding it.
The weight and rank of each stock in the portfolio is listed in the table above. Summing everything up, the rank of SKYY is 54.42, meaning in aggregation, SKYY is better than only 54% of stocks in the market. The rank put it at a level pretty much the same with the entire market in average. Based on the predictive power of our ETF ranking system, it is likely a market performer.

The weight and rank of each stock in the portfolio is listed in the table above. Summing everything up, the rank of SKYY is 54.42, meaning in aggregation, SKYY is better than only 54% of stocks in the market. The rank put it at a level pretty much the same with the entire market in average. Based on the predictive power of our ETF ranking system, it is likely a market performer.
We also compared its theoretical performance to our cloud computing portfolio. Since June 13th, the inception date of our cloud computing portfolio, our portfolio rose 16%, while SKYY would have risen 10% if it was created on June 13th. Nonetheless SKYY's performance is better than the 5% return of S&P 500.
As Dana Blankenhorn figured, investors can find the best cloud computing stocks on their own.
Tuesday, July 5, 2011
Google Page Ranks of Financial Blogs
I list below the Google page ranks of some financial blogs. By no means this is a complete list of financial blogs. Neither do the page ranks speak anything about the quality of the blogs. Just for fun.
- http://online.barrons.com

- http://seekingalpha.com
- http://www.gurufocus.com

- http://blog.iii.co.uk
- http://aswathdamodaran.blogspot.com
- http://www.gannononinvesting.com

- http://greenbackd.com
- http://www.valuewalk.com
- http://blog.empiricalfinancellc.com

- http://blog.newconstructs.com
- http://trustamind.blogspot.com
The Coming Earnings Season Will Determine Market Direction
A recent post on ValueWalk.com provided a nice summary of the current market valuation:
- P/E (TTM) – Fairly Valued 15.0
- P/E 10 year – Extremely overvalued 23.67
- P/BV – xtremely overvalued - 3.68 (using numbers discussed above from April)
- Dividend Yield – Indeterminate/ overvalued 1.72
- Market value relative to GDP – Moderately Overvalued 97.1
- Tobins Q – Extremely overvalued 1.19
- AAII Sentiment – Average
My takeaways are
- 1 & 5 indicate that the valuation is supported by growth expectation
- 7 signals that investors are not euphoria about their growth expectation
- 2, 3, & 6 simply mean that inflation is looming
Thus the coming earnings season is highly important because market valuation is supported by growth expectation. If corporate earnings can keep the current pace, i.e., FPE = PE, then the market is fairly valued and will be range bounded after it. If corporate earnings will fall or rise, so will the market.
It is healthy that investors' sentiment is at average level right before the earnings season. It appears that investors didn't commit to a big bet yet, meaning the market may not move drastically if there is any surprise.
Saturday, July 2, 2011
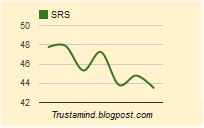
Sector Rank Spread Moves Lower
The Sector Rank Spread moved lower last week. Although the earnings season does not officially start, many companies already reported earnings or will soon report it. As new fundamental data entering the ranking system, we are expecting to see fluctuations of the ranks and the SRS. At this point I wouldn't jump to any conclusion. Still a shrinking SRS reduces the tendency of sector rotation and add less fuel to the rally. As always, cautions are suggested.


Thursday, June 30, 2011
Entering SeekingAlpha's Top 50
Currently I'm ranked the 50th instablogger on SeekingAlpha. Just dumped a screenshot so I can brag about it later. My pen name on SeekingAlpha is Diffusion.


Cautious Is Healthy
A piece on Barron's today listed a couple of cautious signs:
- Possible end-of-quarter window dressing
- Cautious comments from prestige investors
- Anemic trading volume
- Investors park money in money market
We just passed an exhaustion bottom - It's a round shape on the chart. Market sentiment is at inflection point. It is understandable to be cautious. This explains the low volume. Plus there is a major holiday next week. A couple of fear factors, such as TED spread and Libor OIS spread are all in the comfort zone, indicating the credit market is still stable.
Wednesday, June 29, 2011
Big Money Index an Lagging Indicator From Now On?
Lately the Big Money Index behaved more like a lagging indicator. Around late May there was a negative divergence between BMI and S&P 500, but S&P 500 didn't follow BMI to move higher. Instead, BMI followed S&P 500 and move lower. Now there is a negative divergence under development. However it appears that this time S&P 500 will lead again.


BMI was designed to indicate the money flow into or out from the market. And it has been a leading indicator for two years. The recent change could signify that we are now in a different phase of the bull market.
In the past two years when BMI was leading, investors have correctly anticipated the trajectory of the market. But from now on, investors' predictive power is likely diminished, and they may just follow the market up and down. Indeed, in the past two years, the macro economic trend is determined by fiscal and monetary stimulus, which is relatively easier to predict. But from now on, with stimulus being unwound, the effect of other factors started to emerge. The market internals are a lot more complicated and it's thus harder for investors to predict.
I'll keep an eye on this. If there is any negative divergence down the road, I'd like to favor the chance that BMI will follow S&P 500. Still a negative divergence would mark a significant bottom or top of the market.
Saturday, June 25, 2011
Sector Rank Spread Continues Uptrend
The Sector Rank Spread edged higher and it continues uptrend. The development is positive as the tendency of sector rotation increased, which will add fuel to the bull market.


The new Risk Appetite Spread edged lower but its uptrend appears intact. It's also positive to the bull market as risk appetite is in the mending,


Thursday, June 23, 2011
Introducing Risk Appetite Spread
What is Risk Appetite Spread? Denote R(x) to be the fundamental rank of an ETF. Risk Appetite Spread is
((R(IWF) + R(IWO)) /2 + R(SLY)) / 2 - ((R(IWD) + R(IWN)) /2 + R(ELR)) / 2
Where (R(IWF) + R(IWO)) /2 represent the fundamental rank of growth stocks, R(SLY) represent that of small caps. The average of these two represent the fundamental rank of risky assets. (R(IWD) + R(IWN)) /2 represent the fundamental rank of value stocks, R(ELR) represent that of large caps. The average of these two represent the fundamental rank of safe assets. In theory a high RSA indicates that risk appetite is on and will add fuel to a bull market.
Read more on ETF Ranking and Fundamental Ranking.
Where is RAS? It is located to the lower right corner on my blog. Similar to Sector Rank Spread, RAS is calculated and updated every weekend.
Wednesday, June 22, 2011
More on Asset vs. Income
Greenbackd kindly replied my comment to his post and offered some intriguing ideas. The discussion becomes more interesting and I would like to duplicate it here.
P/B is predictive in the aggregate, but possesses qualities that are unattractive to me, for example, preferring highly leveraged balance sheets. LSV (among others) examined P/B in their Contrarian Investment, Extrapolation, and Risk paper, and found that it was predictive (Of course this finding needs to be tempered by O’Shaugnessy’s observation that the smaller deciles are uninvestable because they are too small). For me, it’s a matter of finding a metric that avoids P/B’s unattractive qualities. I have some other research on another metric that produces returns in the same magnitude as P/B, but avoids the highly leveraged balance sheets (it actually prefers a unleveraged, cash-rich balance sheet). I would still not, however, use it in isolation. LSV note in the same paper discussed above that using another metric (cash flow-to-price (C/P), earnings-to-price (E/P), and 5-year average growth rate of sales (GS) alongside P/B improves its returns. I think that’s the obvious solution to avoid the temptation to swing from assets to earnings etc because you’d be using it all the time.
And below is my reply.
Yes, Indeed.Of course a better way is to know where we are and use the “right” formula accordingly. But I guess few have this capability.Then a couple of ideas popped up while I was typing.
- Statistically bear market is 1/3 in length of bull market. So maybe we use both, but assign a higher weight to income and a lower weight to asset.
- Focus on income, and use asset as a cut off screener. This will offer some downside protection during bear market. Actually I have a SeekingAlpha article about this “Cloud Computing: Design a Portfolio for the Best, Normal and Worst”.
- Hedge. A simple one is to hedge with a short position of SPY when SPY is below 200 MA. Or rather stay out of market when SPY is below 200 MA.
The list can be expanded further. I think the key is that we don’t want a formula to handle all problems for us.
Asset vs. Income
A recent Greenbackd blog post brought up the contrast between asset-based metrics and income-based ones. Lately I came across an Interactive Investor blog post and was thinking about the transition among growth, value, and balance sheet during a business cycle. In brief, investors favor value stocks in early bull market, growth stocks in late bull market, and balance sheet in bear market. Now it’s clear to me that investors are just swinging between asset and income. In a bear market, investors are conservative, so they favor asset and chase solid balance sheet. In a bull market, investors are aggressive, so they favor income and chase growth. And value is just a transitory choice in between.
Monday, June 20, 2011
Cloud Computing Portfolio Rose 2% in One Week, Four Times Market Return
Five trading days have passed since we published our cloud computing portfolio on SeekingAlpha: "Cloud Computing: Design a Portfolio for the Best, Normal and Worst". Because we were boasting that our ranking system is for short term, specifically one week return, it is a good time to have a check on the performance.
Comparing to Jun. 13th close price, the equal weighted portfolio rose 2%. In the same time, S&P 500 rose 0.5%. In our article we estimated that our cloud computing portfolio will beat the market by three times. It actually outperformed by four times. The extra return may be explained by the halo of cloud computing.
Saturday, June 18, 2011
Sector Rank Spread Edged Lower
The Sector Rank Spread edged lower last week, but still in uptrend. It is positive that the tendency of sector rotation is still in mending which will add fuel to the bull market.


Friday, June 17, 2011
RIMM Is Less Likely a Buyout Target
Financial analysts are contemplating that RIMM could be a potential buyout target and the dead money encapsulated in its asset would have a second life. We think it's less likely the case.
Technology advances is brutal. Being obsolete is equal to being dead money. RIMM's assets are tied to manufacturing or servicing its products, email smartphone. If email smartphone is obsolete, so would be its assets. And obsolete assets fetch little cash.
We don't have numbers so we base our discussion on categories.
First it comes to the assets for manufacturing. This include the design, plant, machinery, inventory, etc. Suppose RIMM is acquired. Let's try to figure out what the buyer would do with RIMM's manufacture related asset. Although financial analysts wouldn't see the difference, entrepreneurs in technology sector would know better. Switch to a new design or manufacturing process requires tremendous effort to redo the design, retooling the machinery and re-configuring the plants, especially when the technology is obsolete. More often than not, it cost more than come up with a new design or build a new plant from scratch.
Using TV as an example, would customers buy a cathode ray tube (CRT) when LCD is available on the market? Not likely. Would an entrepreneurs buy a CRT manufacture when LCD technology is ready? Not likely, either. Although a CRT manufacture makes TV like a LCD manufacture does, the technology is hugely different. The tool that was designed to handle tubes is not going to handle flat panels. So are the workers. They lack the experiences.
Secondly, how about the assets servicing existing products? RIMM owns network operation centers that service its customers. But RIMM's market share is diminishing. Therefore down the road its capital expenditure will have less return because it services a shrinking customer base. Would a buyer like to invest more money on assets with gloomy future? Not a sane one.
Analysts may also argue that a buyer can take advantage of RIMM's existing market share. How? By paying customers to switch to new products or services? They are switching without incentives anyway. Why bother burn cash for it? Leave them alone? Then we go back to the second case where the buyer faces diminishing return on capital.
RIMM might be a hiding gem, but we didn't see its value as a buyout target.
Wednesday, June 15, 2011
Bubble Is a Process
Currently there is a debate ongoing at The Economist. The topic is whether we are in a new tech bubble. Although I couldn't agree with the defender of the motion that we are in a bubble, I agree with him that a bubble is a process, not an event. Mr. Steve Blank, the defender, stated that a bubble has four phases: stealth, awareness, mania and blow-off. Certainly the entire society benefits from the first two phases. Arguably investors benefit from the first three phases. So a bubble is not always a bad thing, if investors know when to exit. But that is a big if.
Tuesday, June 14, 2011
Money Flows to Energy and Materials
A recent Focus on Funds blog post on Barron's cited a piece of research from S&P equity research team saying that energy and materials have "experienced the largest money inflows as a percentage of total assets so far this year. "
In the second-quarter, [energy's] inflows were up 3% on the heels of a strong 8% inflow surge in the first-quarter.Basic materials, the second most popular fund group in 2011, came in nearly 3 percentage points less in terms of net inflows.
Readers of my Sector ETF Ranking Articles at SeekingAlpha.com would know that my ETF ranking system continuously rank XLE and XLB to be the top two offensive sector ETFs since inception this May, matching the market consensus reflected by money flow. I believe this is a strong proof that fundamentals drive returns, even in short term.
Saturday, June 11, 2011
Sector Rank Spread Breaks Downtrend
The Sector Rank Spread saw a big jump last week and the downtrend is broken. This positive development is encouraging as it improves the tendency of sector rotation which adds fuel to the bull market.


Thursday, June 9, 2011
Why Liquidity Matters
It is so obvious why liquidity matters when it comes to performance of value investment strategies. I'm a little embarrassed not being able to articulate it in my previous post.
Liquidity generally reflects popularity of a stock. Popularity means that a lot of investors pay attention to the stock. There is an saying in the world of computer geeks that "Given enough eyeballs, all bugs are shallow". Similarly, all pricing errors are shallow given a lot investors are watching it. The less pricing error, the less profit left for value investors. Thus the inverse relation between liquidity and performance.
Intrinsic Value and Market Process to Discover It
Professor Aswath Damodaran made a sharp argument in his latest blog post to separate the intrinsic value and the market process to discover it.
And my answer is
It all starts from the basics. By definition, a piece of asset is something that can make income for its investor. Such as a house making rent, a company making profit. And the intrinsic value of the asset is tied to the asset's ability to make money.
But in a financial market, the asset is not priced by its intrinsic value. It is priced, however, by the supply and demand of associated securities, such as stocks, bonds, etc. Someone believes the market is efficient, so the price reflects the intrinsic value. But more often than not, prices of securities are pushed away by a lot of other factors. Investors may suddenly lose confidence to a company and the price of its stock crashes.
The task of a value investor is thus to understand the intrinsic value and jump in when market offers opportunities by wrongly pricing the securities.
But things become interesting if we dig one step further.
Who determine the rent of houses? Market! The rent of houses is determined by the demand and supply in the rental market. The same to a company. If a company sells products, its incomes is determined by the price of its products. Again it's a market that determines the price of the products. Yes the market is not a financial market. But it appears that market is the only way to discovery and realize value in human society.
In our discussion, Professor Damodaran summarized that
In many ways, one of the problems with financial asset markets is that they are markets for financial assets overlaid on markets for real products and services. In intrinsic value, you are estimating the value of financial assets, given the real product market below. You could conceivably carry intrinsic value one step further and ask whether the rental market is intrinsically fair...
Sure no market is absolutely fair. But we have to live with it. Probably take advantage of it.
Wednesday, June 8, 2011
Inverse Relation between Market Cap and Performance Echoes My Research
Empirical Finance Blog has an interesting post today discussed an inverse relation between market cap and performance of Magic Formula. This echoes what I have observed in my research.
According to my research, there is an inverse relation between liquidity and performance. Annualized return drops if I require more liquidity. Because large market cap generally fetch better liquidity, what I observed in my research generally echoes what Empirical Finance Blog has observed. I think 30% annualized return by Magic Formula is doable if we loosen the requirement on liquidity. However, investors may or may not be able to get rich with that because they couldn't invest too much money on a thinly traded stock. At least it is the case with my ranking system as I do weekly rebalance. But it is still arguable that if the holding period is 6 months to 1 year, investors can spend weeks or even months to accumulate a position, so liquidity may not matter.
Sunday, June 5, 2011
ETF Ranking Newsletter Will Resume Next Week
ETF Ranking Newsletter will resume next week. To subscribe, go to my blog and find the link to the top right corner under SERVICES section.
Saturday, June 4, 2011
Sector Rank Spread Recovered a Bit but Still In Down Trend
The Sector Rank Spread recovered a little bit last week. But as it failed to make a higher high, the down trend is intact. A positive sign is that the latest downdraft seen the week before last week is of less magnitude than that of previous ones. As this week's move revert to the upside, SRS may start to bottom out. If succeeds, it will add more fuel to this bull market and benefit all investors.

Thursday, June 2, 2011
My Crystal Ball Is Blurry
The Big Money Index made a decisive downdraft today and breached previous significant low seen on May 5th. Technically this confirmed that BMI is now in a down trend. I have been using BMI as a leading indicator for about two years and this is the first time a positive divergence failed. The sharp downdraft indicated that money fled out of the market in a rush and further weakness is expected. But because this time BMI failed to work, I don't want to rush into the bearish conclusion.


So I turned to other charts to gain more clues. The first chart I looked at is TLT. Usually investors flew to Treasury bonds when they tried to avoid risk asset, i.e., the stocks. On the chart TLT formed a technical pattern named "blow-off top". Yesterday it decisively broke to a new high with huge volume, while today it fell back in the same decisive manner and with even higher volume. Usually a blow-off top indicates a key turning point of a trend. It happens when an established trend finally attracted attention of mediocre investors. As they rush in to ride on the trend, the last portion of buying power is exhausted. Smart investors will take the opportunity to offload their positions and the late comers become the unlucky bag holders. They couldn't find anyone else to pay a higher price for their holdings and the price will enter a down trend.


It would be an encouraging signal to stock investors if TLT starts to fall from here. I also took a look at the chart of SPY. On its chart I saw a pattern named "breakout pullback". On May 31st, SPY break out to the upside of a down trend channel. Unfortunately the very next day it fell back into the channel again. This often happens when a down trend has run its course and an up trend is about to establish. Some market participators try to sharply drive down the market to test its determination. In fact a dreadful psychological test happened today when SPY breached its previous low. When a key technical support is breached, weak hands will surrender their positions. A positive sign is that today SPY closed above the support line, meaning it could be only a test. A typical breakout pullback serves to purge out weak hands before the market starts to rally.


If both TLT and SPY point to a bullish outcome, I'd like to disagree with BMI. Nonetheless my most powerful crystal ball is blurry right now, and cautions is highly recommended. But when should an investor be reckless?
Wednesday, June 1, 2011
Big Money Index at Inflection Point
The Big Money Index is on edge. If it drops below the recent significant low seen in May 5th, technically it forms a lower low and invalidates the up trend. It also invalidates the positive divergence we previously observed, and confirms the down trend of the market.


Saturday, May 28, 2011
Sector Rank Spread Shrank and Down Trend Confirmed
The Sector Rank Spread shrank again last week. As it made a new low, technically a down trend is confirmed. This, together with the sharp drop of BMI, is alarming because smaller spread indicates less tendency of sector rotation and thus less fuel to the bull market.

Friday, May 27, 2011
ETF Ranking: Growth vs. Value
In an early post I showed that we can use ETF rankings to gain insight on where we are in a business cycle by mapping it to the Sector Rotation road map. I found another road map of Growth vs. Value on Interactive Investor's blog, of which I can make similar use.

The research was carried out by Morgan Stanley. It states that value stocks will outperform during early stage recovery and mid-stage bull market, growth stocks will outperform during mid-stage bull market to peak of bull market, then in bear market, balance sheet will outperform till the bottom. Although I'm not aware any ETFs representing balance sheet, there are value ETFs and growth ETFs. Because a highly ranked ETF will outperform the market, we can use this predictive power to learn where we are in the business cycle.
I select iShares growth and value ETFs: IWD, IWF, IWN, IWO. Their ranks are listed below:
- IWO, Russell 2000 Growth Index ETF: 63.19
- IWF, Russell 1000 Growth Index ETF: 58.54
- IWD, Russell 1000 Value Index ETF: 44.77
- IWN, Russell 2000 Value Index ETF: 42.21
Clearly growth is more fundamentally attractive than value at this moment. According to the chart, probably we are in the late stage of a bull market. This matches with the conclusion in our ETF ranking and sector rotation post.
To understand when we will be in a bear market, it would be handy to have an ETF represent balance sheet. If its rank is higher than growth ETFs, then highly likely we are at the beginning of a bear market. If you know a good balance sheet ETF, please let me know.
Thursday, May 26, 2011
My Comment to Interactive Investor's Latest Blog Post
Below is my comment to Interactive Investor's latest blog post: "Mines flood Nifty Thrifty screen". The author worries that "if next year is a bad year for resource companies, it will be a bad year for the Nifty Thrifty", though I think this is just the normal Sector Rotation phenomenon. I think my comments is informative so I just repost it here.
* * *
Thanks for the post. I have similar experiences.
I also have a ranking system similar to Magic Formula. Roughly speaking, Magic Formula has two components: valuation and return on capital. I added one more: financial condition. I tweaked a little bit the formulas within valuation and return on capital, though.
Although I traded my ranking system for only a couple of months, I see the same thing you discussed here. One month ago, all the top names are mining companies, including RIO. But not anymore. I think some bad fundamental numbers entered the earnings reports during this earnings season. As a result, the ranks of top ranked mining companies dropped abruptly.
Nonetheless, I believe it is normal that certain sectors / industries are favored at certain phases of a business cycle. This is actually the well studied Sector Rotation phenomenon. I don't have predictive power so I worry less what's going to happen one year down the road. But I believe I'm in good hands as long as my ranking system tracks the fundamentals closely. If commodity price crashed in the future, the fundamental numbers will crash, too. My ranking system will reflect the changes and I'll exit the positions. In fact this already happened with my ranking system. As mentioned before, now the mining companies are not top ranked anymore and I don't have any of them in my portfolio.
One key point I'd like to mention is: How often do you update the ranks. I insisted to update the ranks every week with my ranking system. Fundamental numbers change slowly, but the changes are usually abrupt. For example, the rank of RIO dropped about 20% one month ago. I think if I don't update the ranks frequently, I'll miss big profit or get caught by big loss.
Another thing is I'm not sure which EY are you using. Some value investor will use 10 year average. But I'll use ttm number. For one, ttm is more popular so it's going to have bigger impact on price, at least in short term. For two, ttm is more sensitive to changes. There will be fluctuations, but I think it pays to follow the fluctuations in the long run.
Wednesday, May 25, 2011
Big Money Index Drops Sharply
The Big Money Index drops sharply today. Usually this not a good sign as it indicates that money has flowed out of the market massively. Nonetheless the positive divergence is still valid. Cautions is highly recommended. Investors and traders want to monitor BMI closely in near future.


Sunday, May 22, 2011
First Editor's Pick from GuruFocus.com
My latest article "Wisdom of Warren Buffett: Avoid Dramatic Growth" wins "editor's pick" from GuruFocus.com.

As I just checked, it is now the front-page headline on GuruFocus.com.


As I just checked, it is now the front-page headline on GuruFocus.com.

Subscribe to:
Posts (Atom)